'/%3e%3cpath%20id='cross_2'%20data-name='cross%202'%20class='cls-2'%20d='M20.612,30.43h0a5.361,5.361,0,1,0-10.723,0H0A33.709,33.709,0,0,1,30.569,0V9.75a5.361,5.361,0,1,1,0,10.723V30.43Z'%20transform='translate(67.193%200.007)%20rotate(90)'/%3e%3cpath%20id='cross_3'%20data-name='cross%203'%20class='cls-3'%20d='M20.612,30.43h0a5.361,5.361,0,1,0-10.723,0H0A33.709,33.709,0,0,1,30.569,0V9.75a5.361,5.361,0,1,1,0,10.723V30.43Z'%20transform='translate(67.186%2067.041)%20rotate(180)'/%3e%3cpath%20id='cross_4'%20data-name='cross%204'%20class='cls-4'%20d='M20.6,30.5h0a5.361,5.361,0,1,0-10.723,0H0A33.71,33.71,0,0,1,30.56,0V9.818a5.361,5.361,0,1,1,0,10.723V30.5Z'%20transform='translate(0%2067.041)%20rotate(-90)'/%3e%3c/svg%3e)
Operations
Operations is the first screen for reviewing the current WebSpace runtime at a glance. Its summary shows cumulative requests, deployed databases, active APIs, and errors.
Runtime summary
| Metric | Meaning |
|---|---|
| Last updated | When the displayed operations data was generated |
| Process started | When the current server process started |
| DB pool | Open connections and leased connections currently in use |
| Storage | Total WebSpace database files and related storage |
| Average response | Average API processing time during the collection interval |
| Metric retention | Retention period and collection interval for operations metrics |
Do not judge brief latency from the average alone. Review endpoint metrics under API & traffic together with the error logs.
Databases
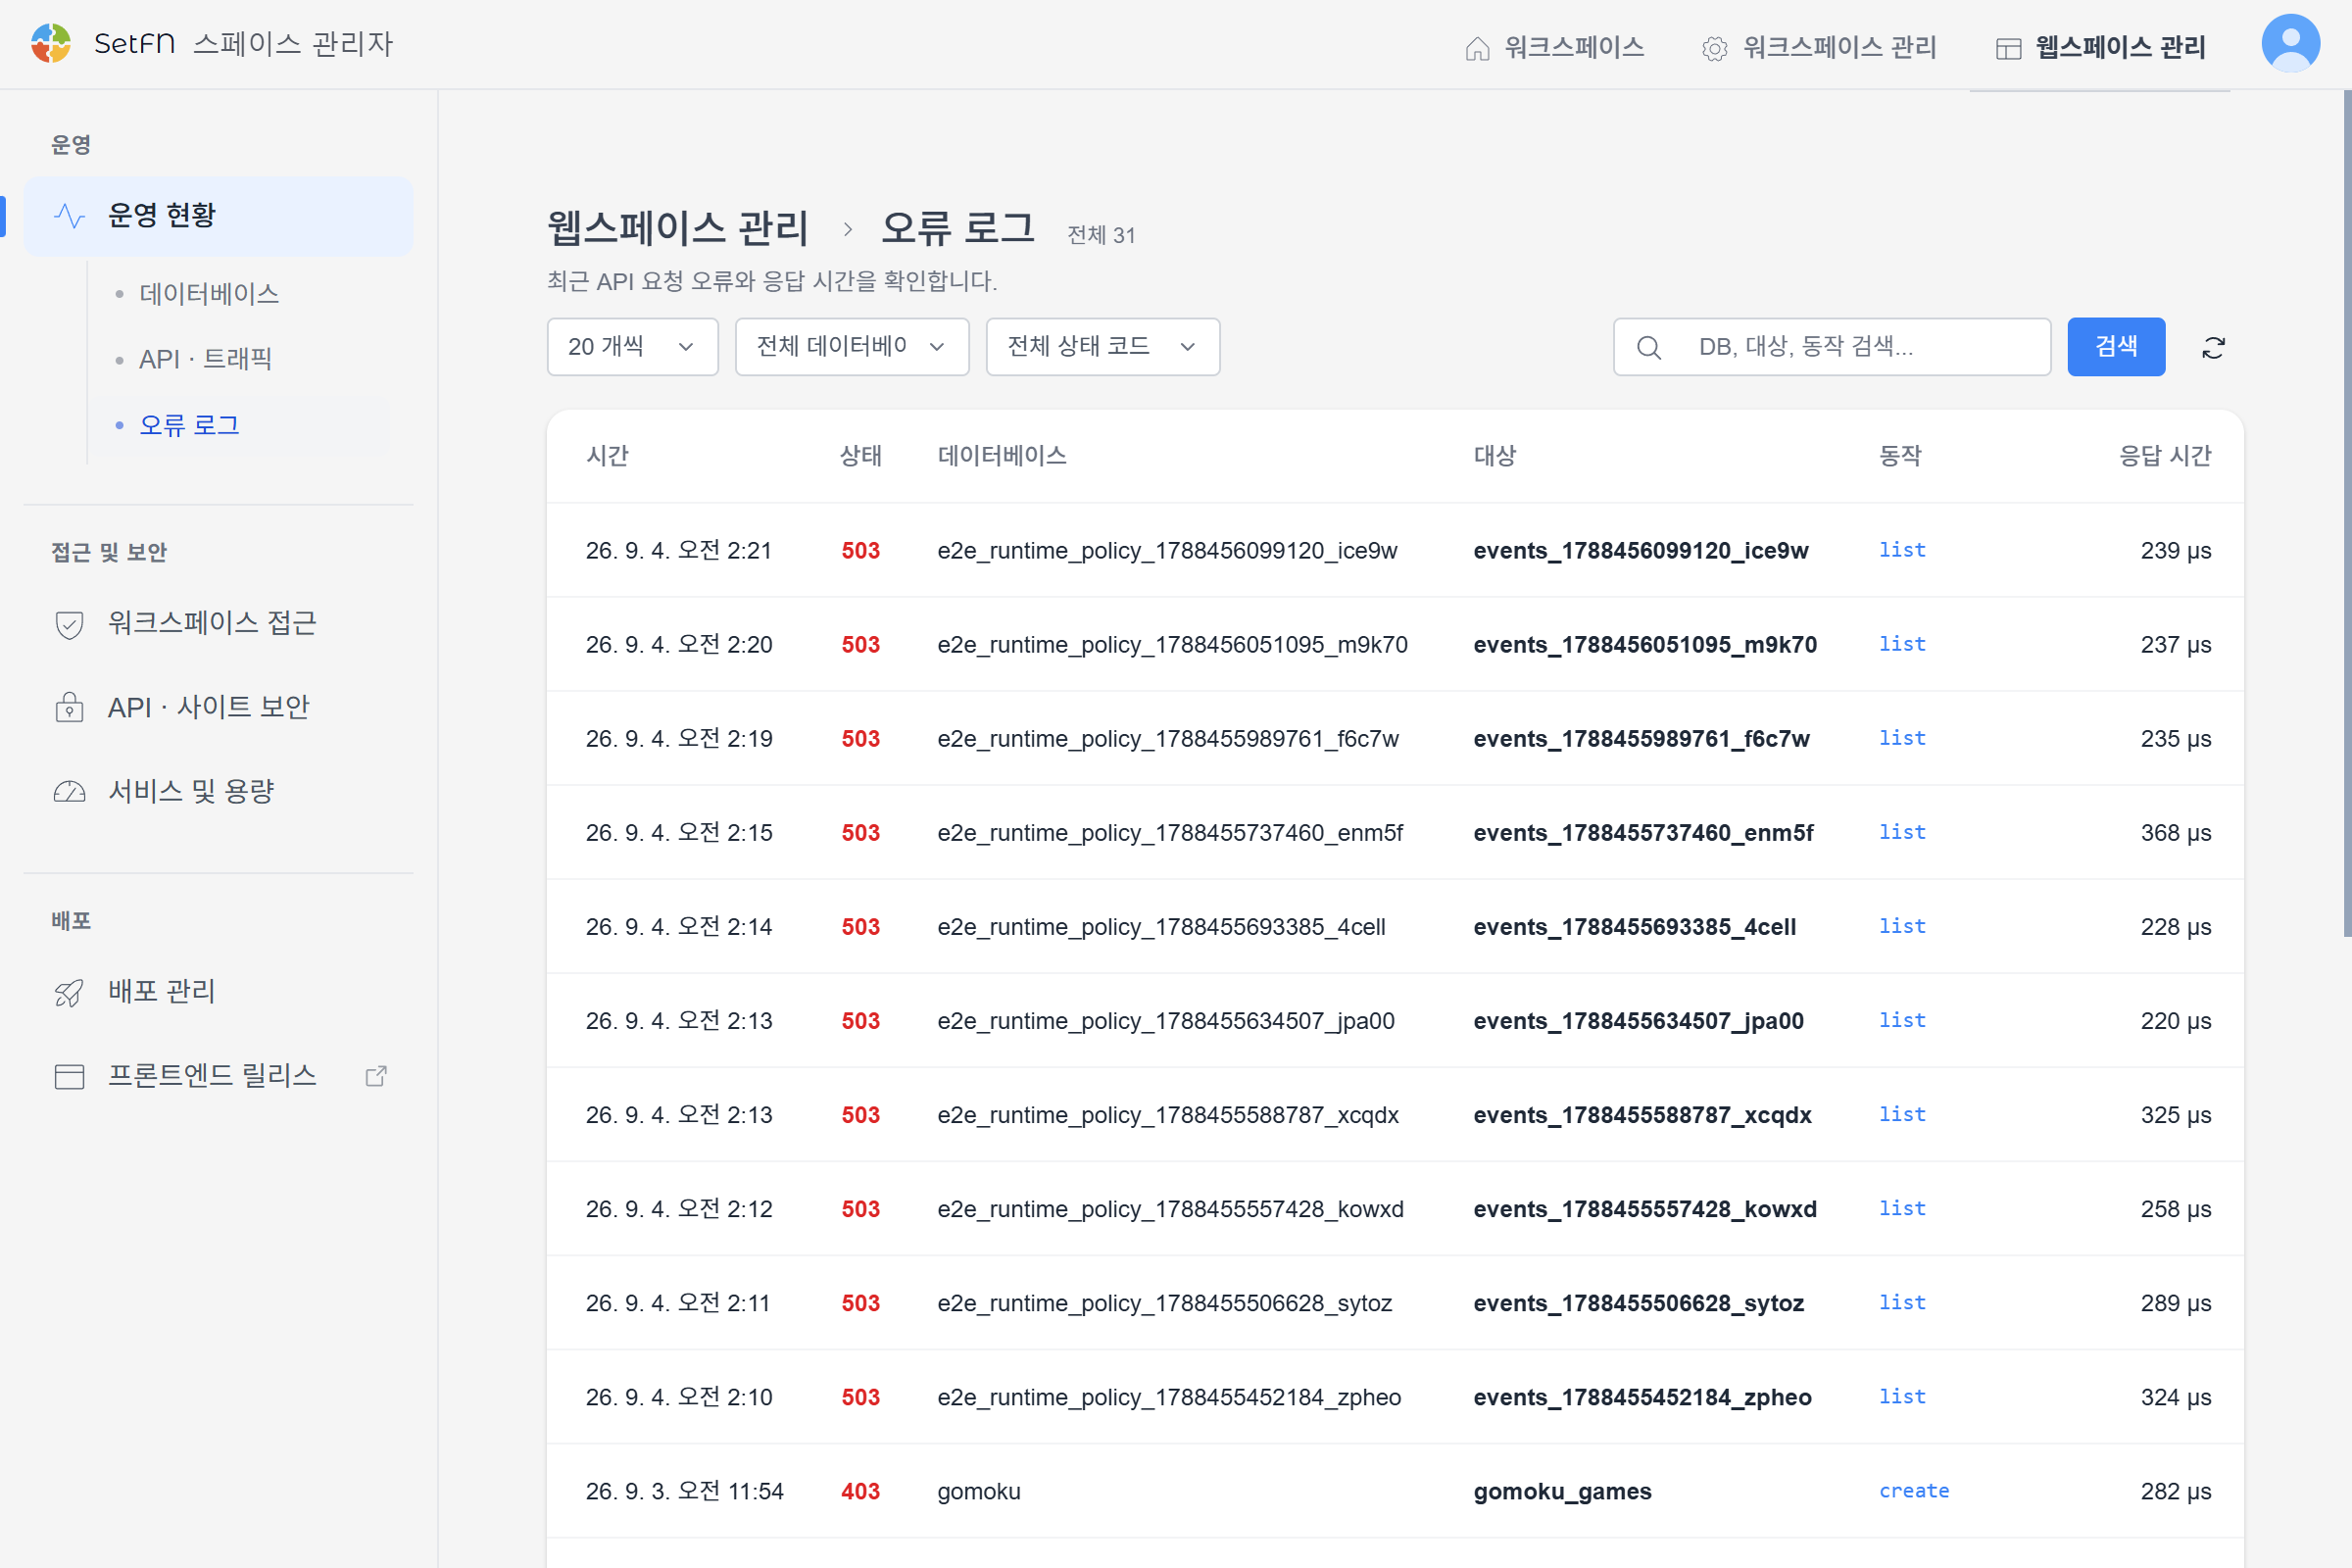
Review each DB's table and endpoint counts, requests, storage, last access, and runtime status. Expand a row to see DB, WAL, and SHM files, pool usage, and an endpoint permission summary.
Operators can stop or restart a DB. Stopping it can block new requests, including new WebSocket connections, so check active services and deployment work first.
API & traffic
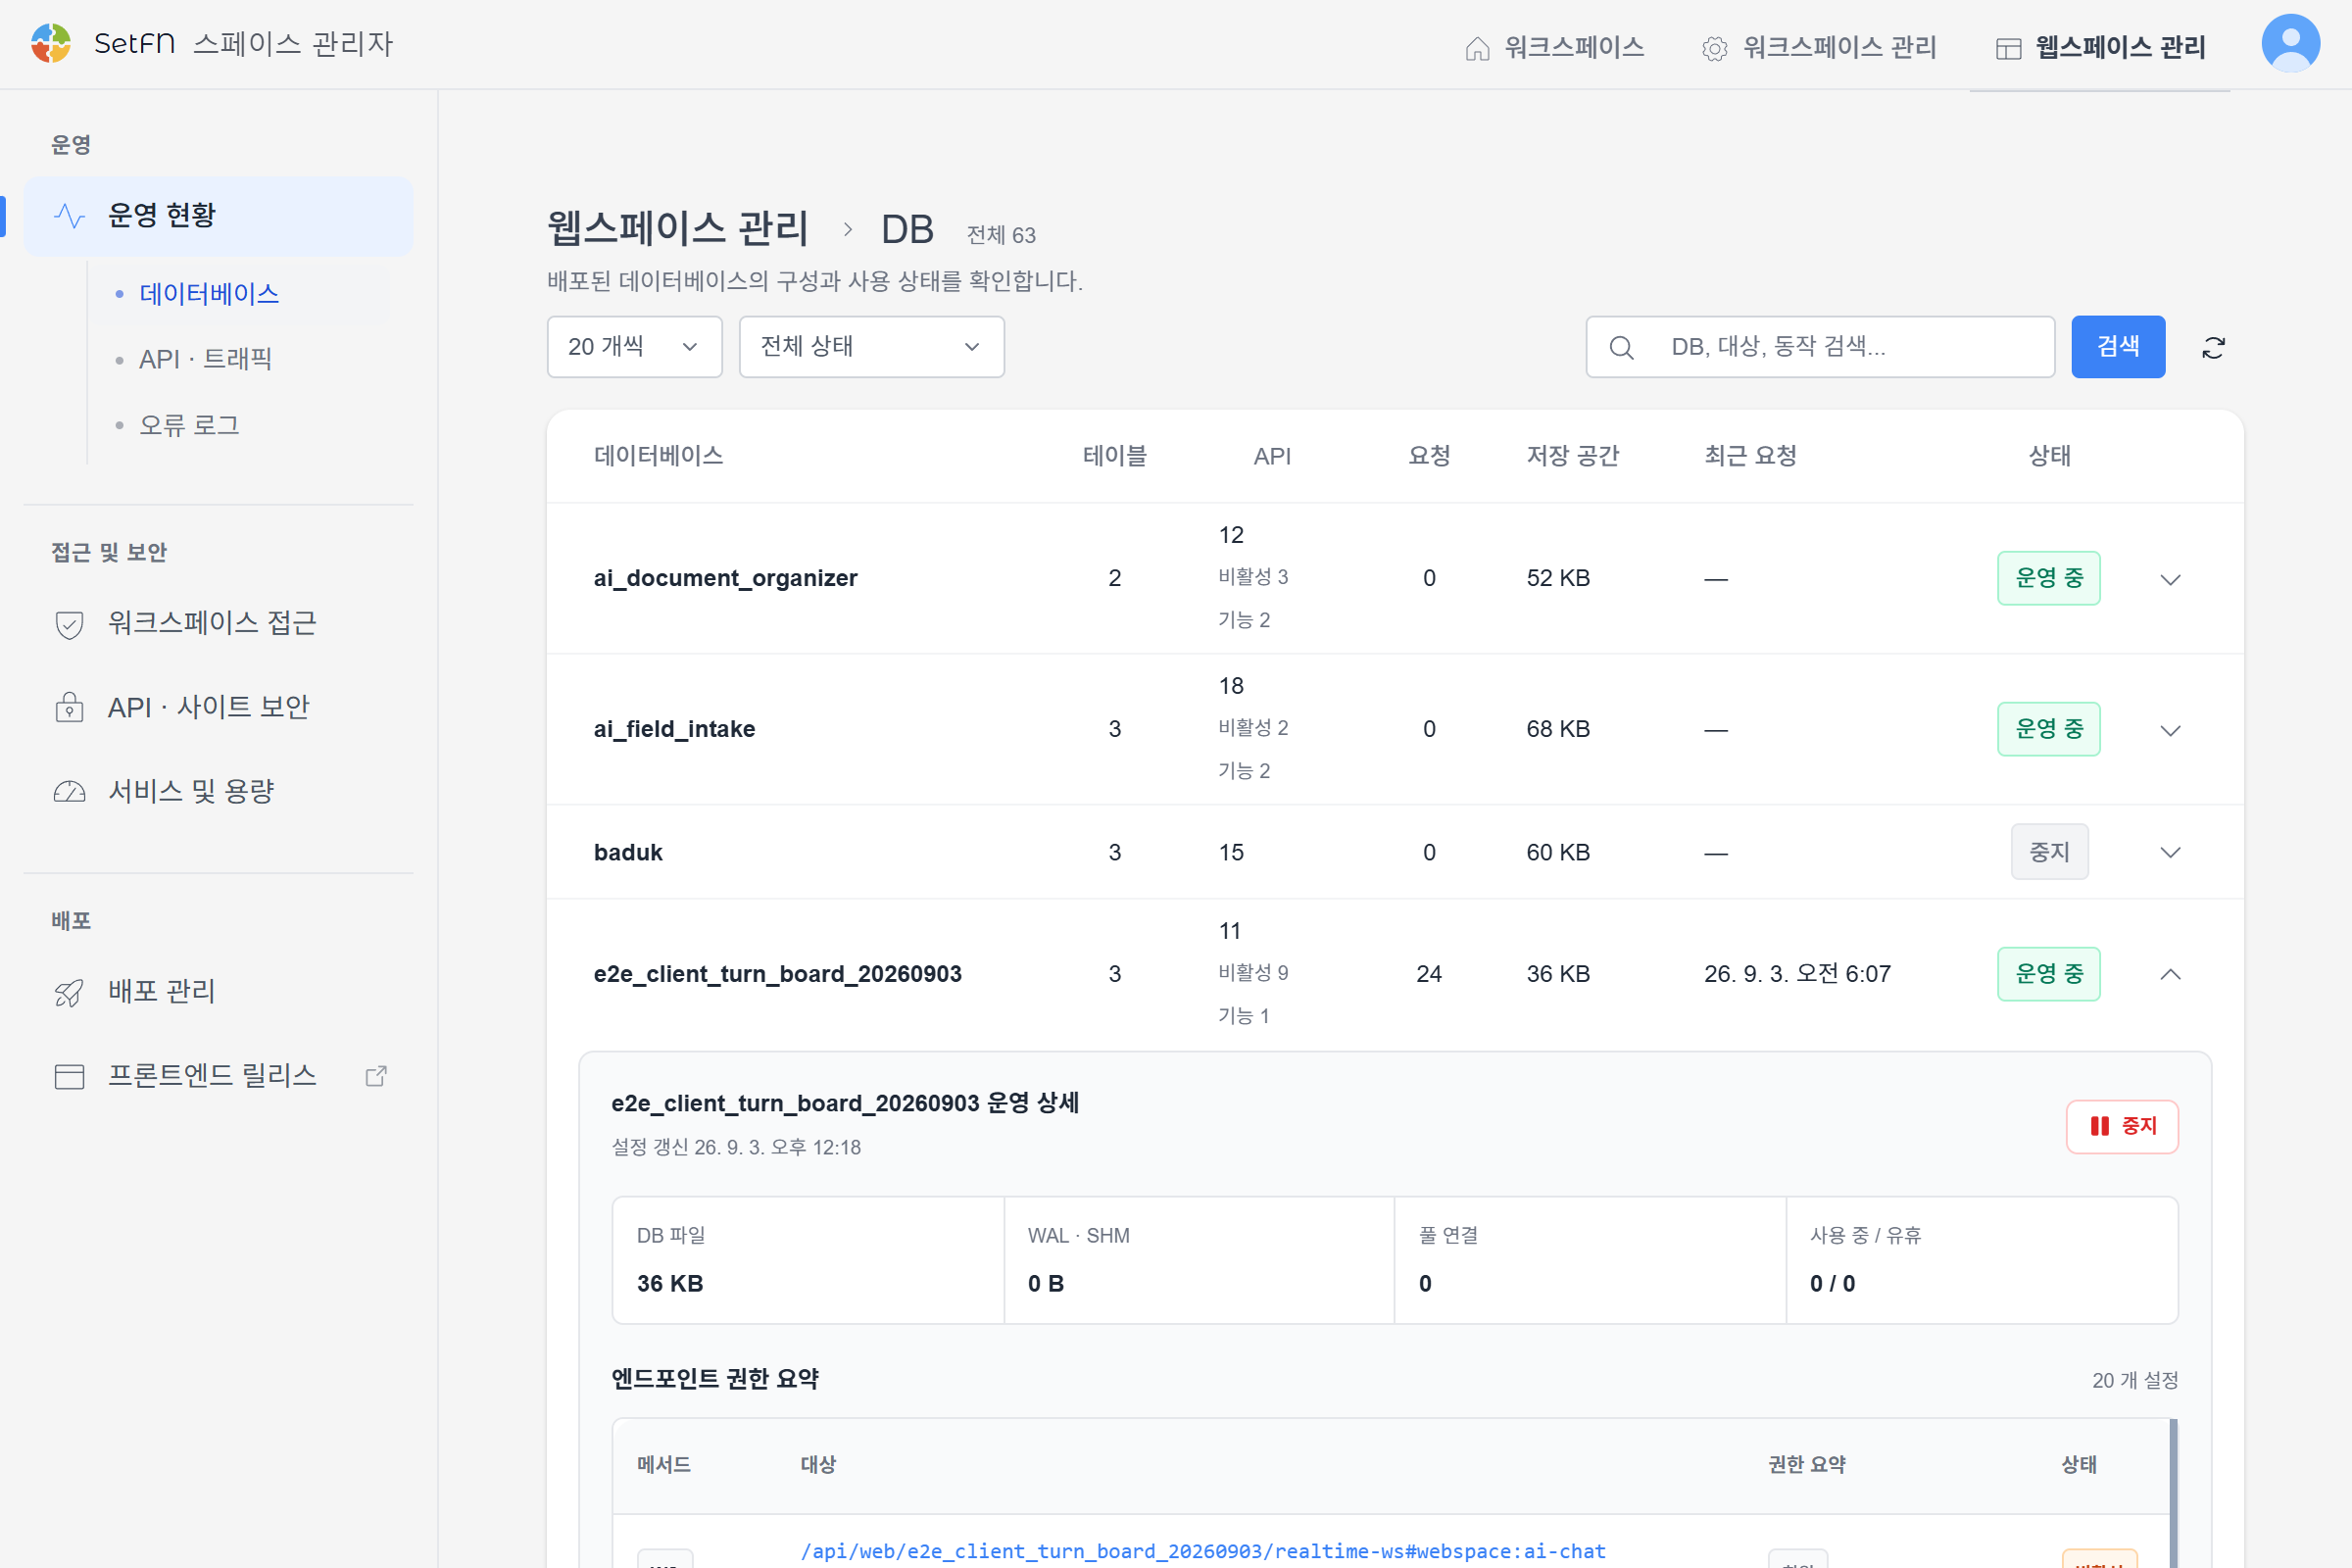
Review request and error counts, average response, and last access by database and endpoint. Narrow the problem using search and the DB, action, and status filters.
Before removing an endpoint with an old last-access time, check its usage cycle and retention purpose, then stop or clean it up as appropriate.
Error logs
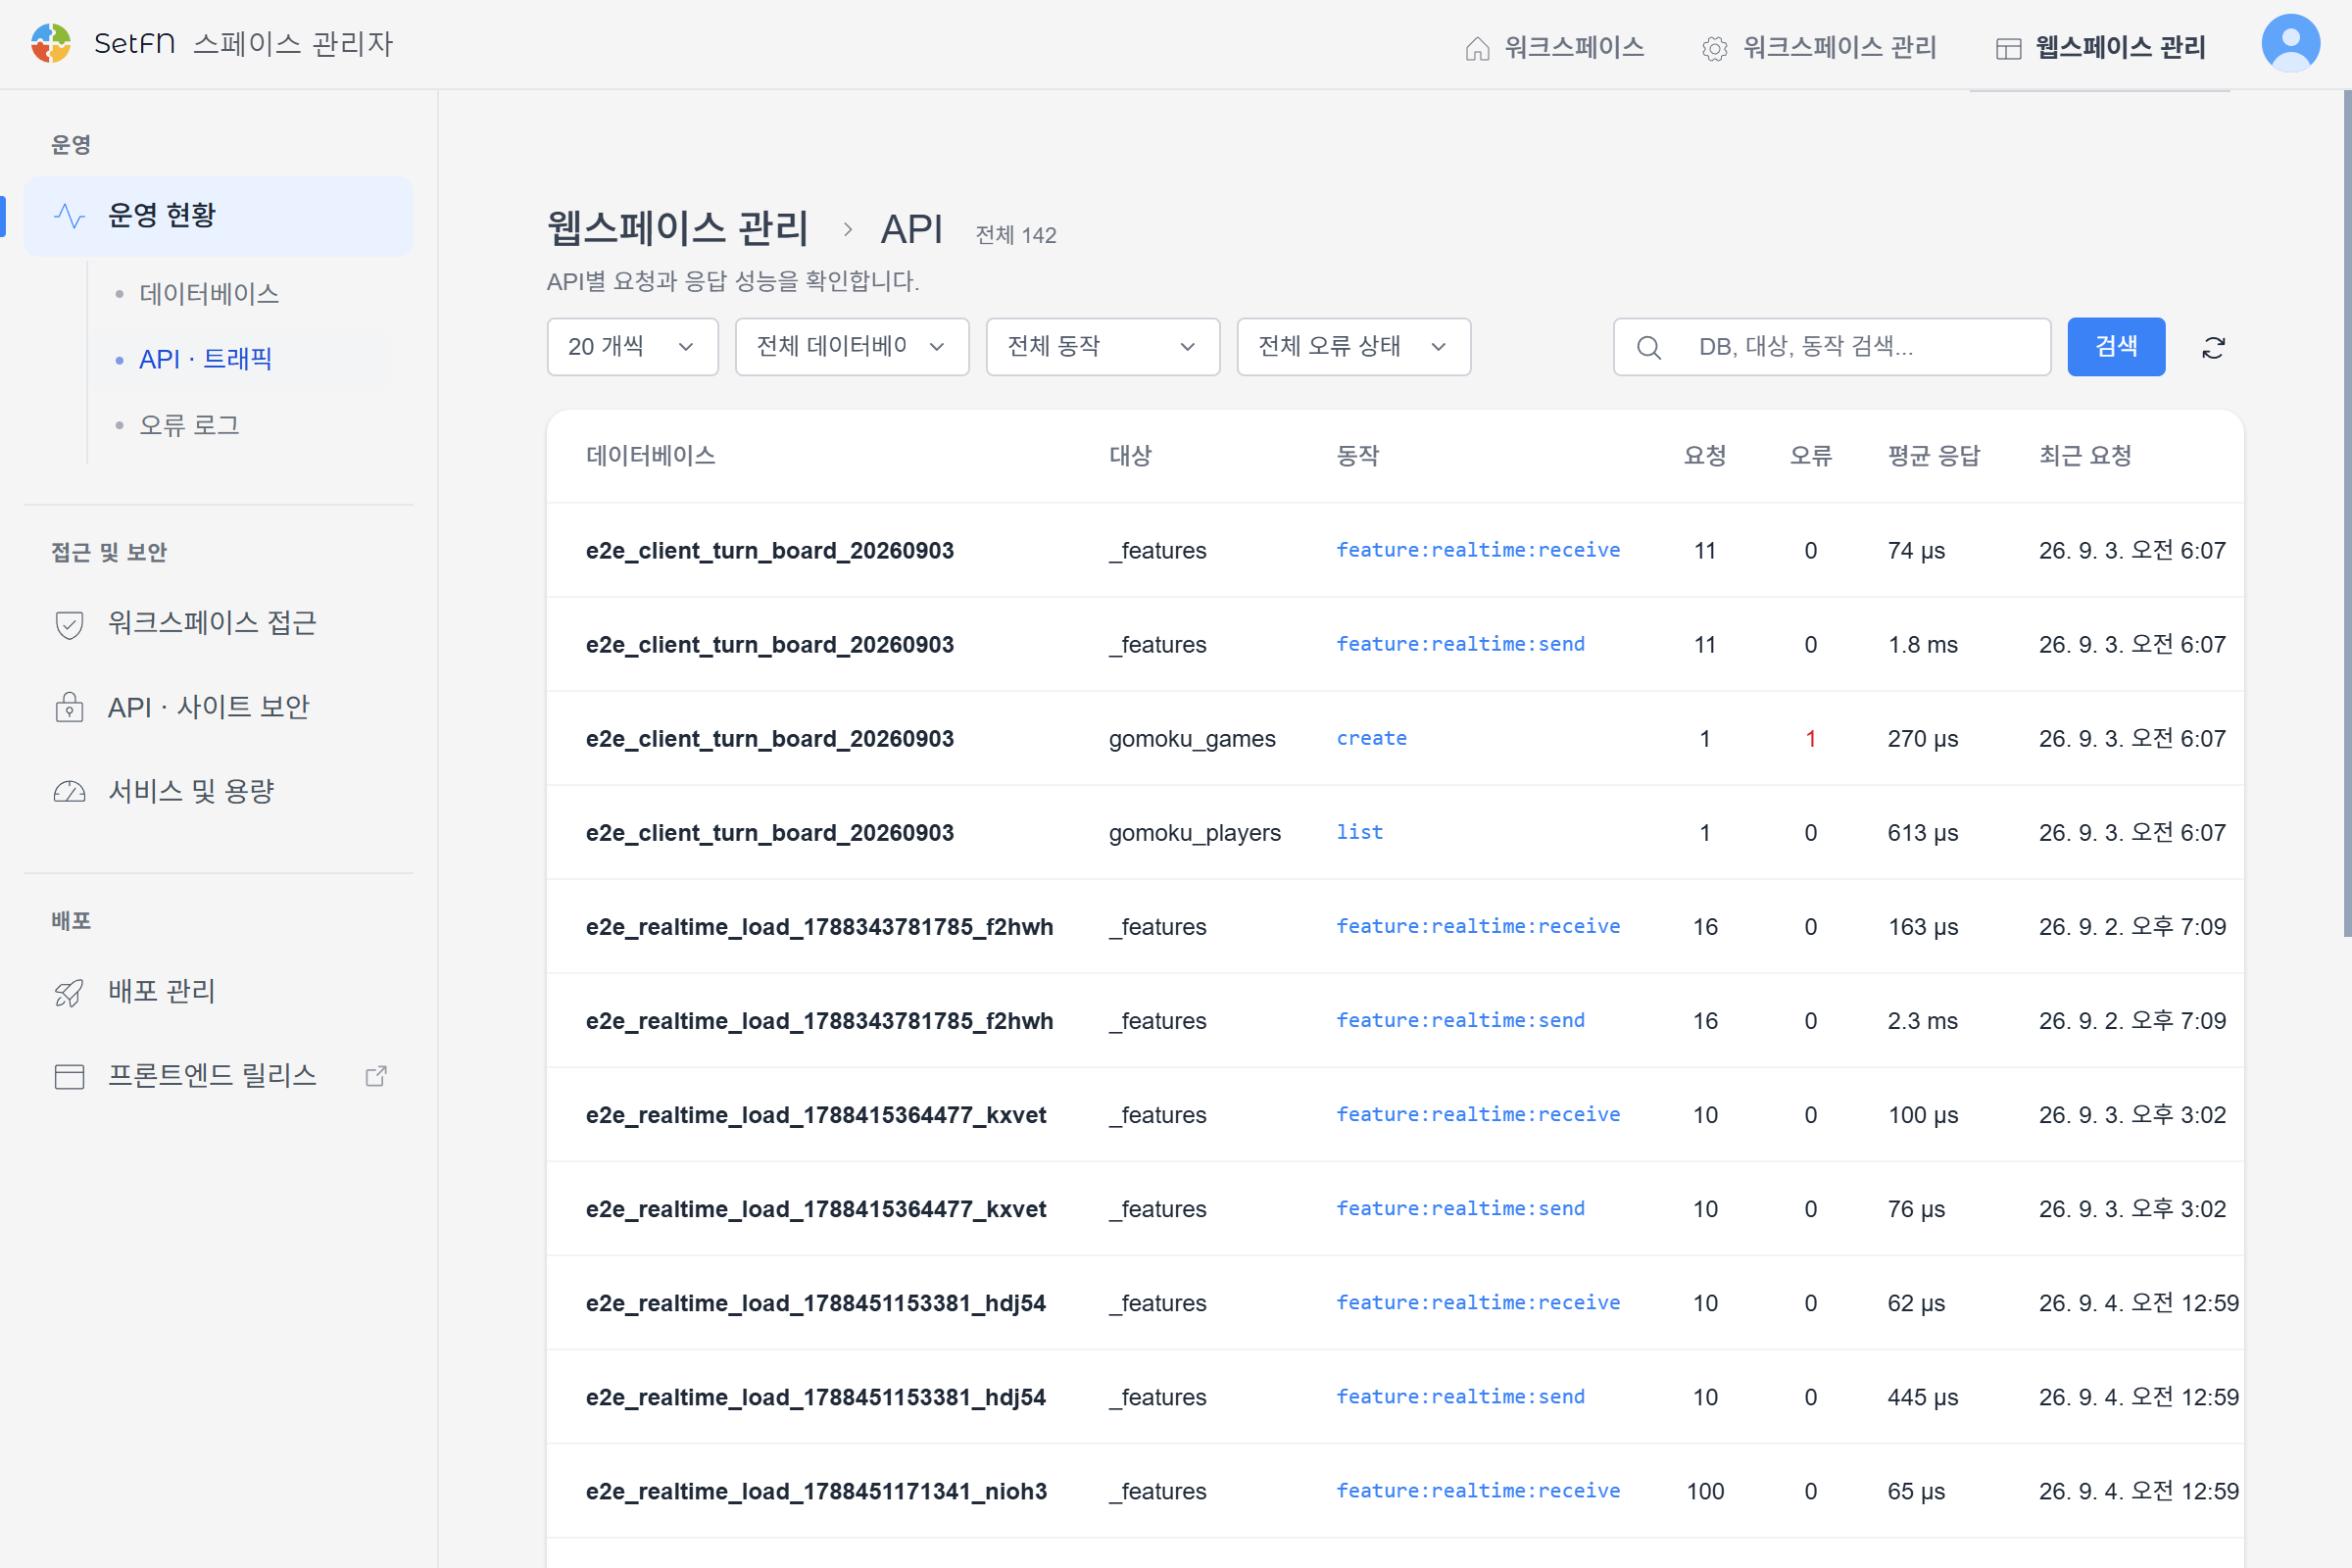
Review the time, HTTP status, DB, target, action, and processing time of recent failed requests. Distinguish authentication and permission errors from server errors, then investigate recurring databases or endpoints first.